Map Animations
Last updated 31 January 2020
Accessing the animation menu
When you first load the model map interface on Pivotal Weather, the default mode is Single Image. In this mode, a single map is displayed on each page, and you must use UI control elements to change to a different model, run, or forecast time. We offer several alternative modes that present a sequence of maps as an animation. In order to change the animation mode, click the toggle button next to “Animation >” on the gray menu bar above the map:
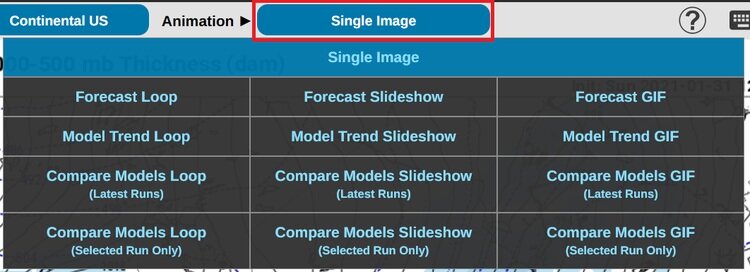

Animation modes: slicing and dicing the data
On the animation menu, you’ll find five rows of options, each corresponding to a different way to slice through the data. These options are described here:
1. Single image mode
A single image is displayed. The blue button links in the left-hand menu are used to move through forecast times within the current model run. The drop-down menu above those button links is used to view archived runs of the model.
2. Forecast mode
A sequence of images for all forecast times of your current model and run. Allows you to view how the atmosphere evolves over simulated time in a single model run.
Example: you’re viewing today’s 12z GFS and enter a Forecast mode animation. A sequence of images for forecast hours 0-384 of the 12z GFS will be displayed, covering the conditions forecast by the model over the next 16 days.
In this mode, the blue button links on the left-hand menu corresponding to forecast times are not necessary, since all forecast times are displayed in the sequence. Clicking one of these links will exit Forecast mode and return you to Single Image mode.
3. Model Trend mode
A sequence of images for all available runs of the model for the valid time corresponding to your current forecast time. Allows you to view how different runs from a single model at a single simulated time have trended as the event has approached in real-world time. This is also sometimes called d(Prog)/dt.
Example: you’re viewing today’s 12z GFS in Single Image mode at forecast hour 24 (valid 12z tomorrow) and enter a Model Trend mode animation. A sequence of images valid at 12z tomorrow will be displayed, populated from every GFS run in our image archive in chronological order. The last image of the sequence will be today’s 12z GFS at forecast hour 24, preceded by today’s 06z GFS at forecast hour 30, today’s 00z GFS at forecast hour 36, and so on.
In this mode, the drop-down list of available runs on the left-hand menu is not necessary, since all runs are displayed in the sequence.

4. Compare Models (Latest Runs) mode
A sequence of images from all available models for the valid time corresponding to your current forecast time. In constructing this sequence, the latest run of each model is used.
Example: you’re viewing today’s 12z GFS in Single Image mode at forecast hour 24 and enter a Compare Models (Latest Runs) mode animation. The 12z GFS forecast will now be one of several models in the comparison UI. Suppose you load this comparison around 16 UTC. Forecasts valid 12z tomorrow from the 12z GFS, 12z NAM, 12z GDPS, 00z ECMWF, and 15z HRRR might be some of the images displayed in the model comparison, since each of these models runs on a different schedule.
5. Compare Models (Selected Run Only) mode
A sequence of images from all available models for the valid time corresponding to your current forecast time. In constructing this sequence, only the run time you’re viewing is eligible to be included.
Example: you’re viewing today’s 12z GFS in Single Image mode at forecast hour 24 and enter a Compare Models (Selected Run Only) mode animation. The 12z GFS forecast will now be one of several models in the comparison UI. Suppose you load this comparison around 16 UTC. Forecasts valid 12z tomorrow from the 12z GFS, 12z NAM, 12z GDPS, and 12z HRRR might be some of the images displayed in the model comparison. Since the 12z ECMWF is not yet available at this time of day, that model will not be eligible for inclusion in the comparison. On the other hand, even though the 13z, 14z, and 15z HRRR are already available, the older 12z HRRR run will be used in this comparison.


Animation views: choosing your perspective on the data slice
On the animation menu, you’ll find three columns of options, each corresponding to a different UI view of image sequences.
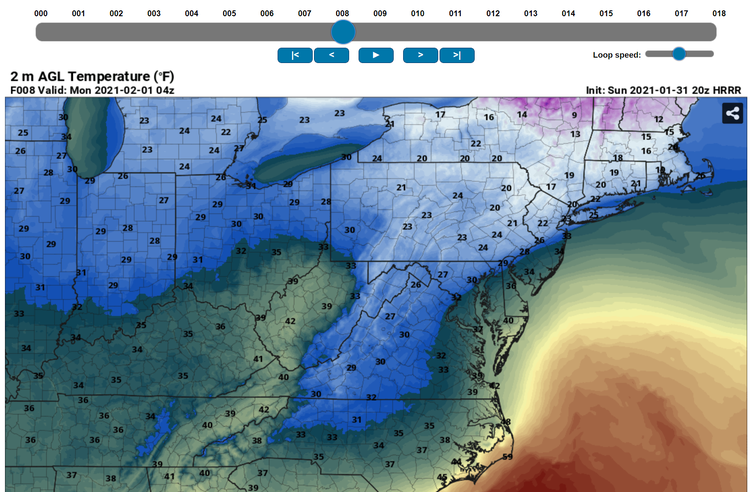
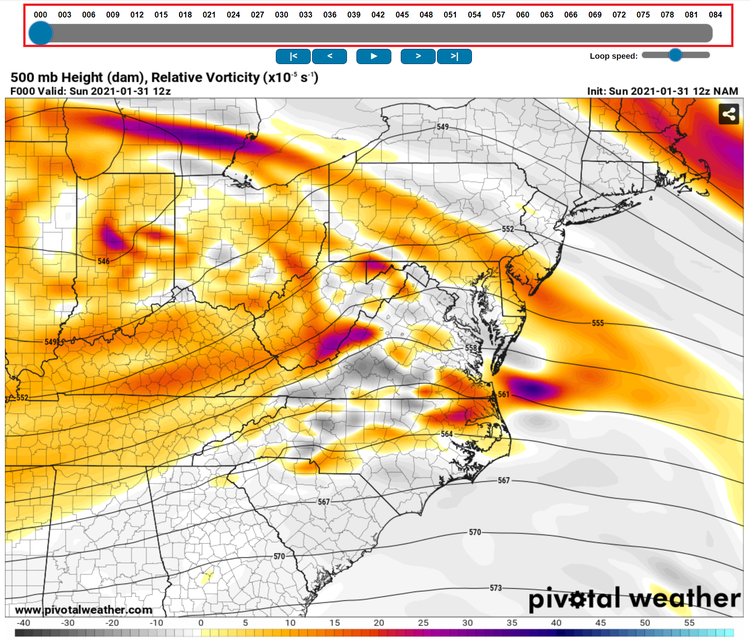
Loop
A slider bar above the map image allows you to scroll, mouseover, or drag (on mobile) through the image sequence. This is the most popular animation view and appropriate for most uses. Note: in the case of Compare Models mode, a series of tabs labeled with models is used instead of a slider bar.
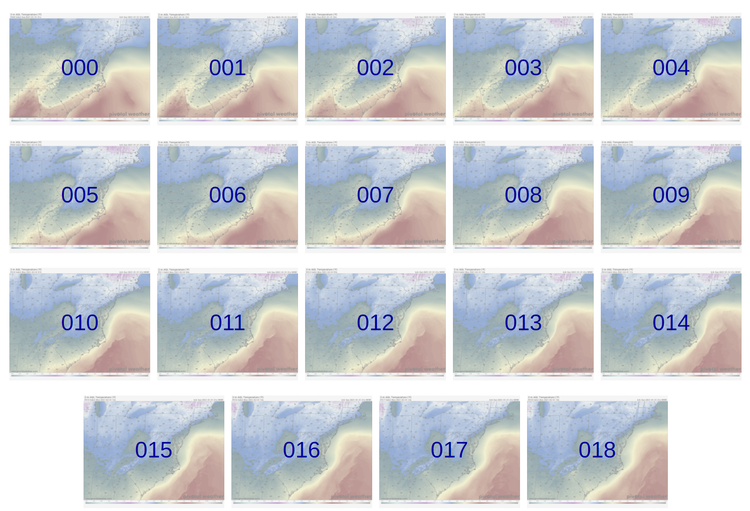
Slideshow
An alternative to looping in which the images are displayed as thumbnails that can be opened to view full screen.
Once in full-screen mode, you can click (desktop) or swipe (mobile) through the sequence and view each image at the maximum size your screen allows.
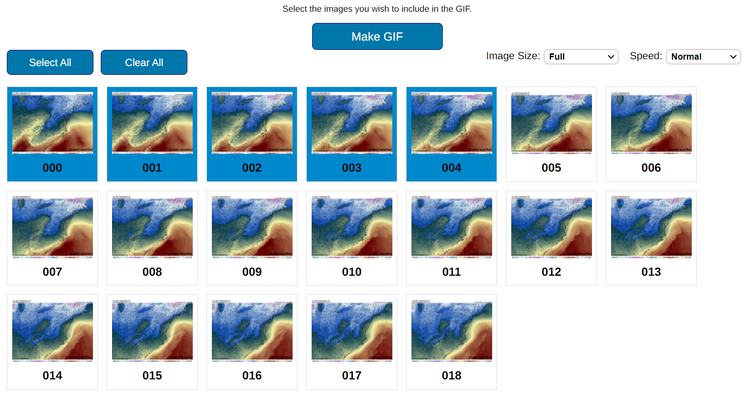
GIF Generator
A simple UI allowing you to choose frames and then generate an animated GIF with some or all of the images in the sequence. Useful for sharing the sequence in a presentation or elsewhere online.
After selecting the panels to include, the image size, and the GIF animation speed, click “Make GIF” and wait a few seconds for your browser to generate the image file. Afterwards, you will see the GIF, along with a “Download GIF” button to save it to your local device.

Summary and tips
The purpose of animation modes on Pivotal Weather’s model maps interface is to facilitate visualizing how model data is changing along a single dimension — either forecast time, run initialization time, or NWP model. Although the number of mode-view combinations may seem daunting at first, we hope this flexibility allows each user to find an optimal way of breaking down the data for their use case(s).
Once you’ve entered an animation mode, certain other animation modes may become disabled on the animation menu until you exit, and UI control elements may behave differently than in Single Image mode as described in modes 1-5 above.
In Single Image and Loop views, the image you’re viewing can be saved to your device by right-clicking (desktop) or long-pressing (mobile) the topmost portion of the image above the map area (where the model, run, and other labels are positioned). This does not work over the main map area of the image because our sounding and value readout functionality supersedes the usual browser menu.